Using Metrics Service (Technical Preview)
Using Metrics Service (Technical Preview)
As a system administrator, use the Metrics Service to view information about the acitivty of services running in the API Mediation Layer. Currently, only HTTP metrics are displayed for core API Mediation Layer services.
In order for the Metrics Service to run, you must set the environment variable APIML_METRICS_ENABLED=true. When this variable is set, the Gateway homepage displays a link to the Metrics Service dashboard. The dashboard is available at https://{gateway_host}:{gateway_port}/metrics-service/ui/v1.`
API Mediation Layer Metrics Service Demo Video
Watch this video to see a demo of the Metrics Service.
View HTTP Metrics in the Metrics Service Dashboard
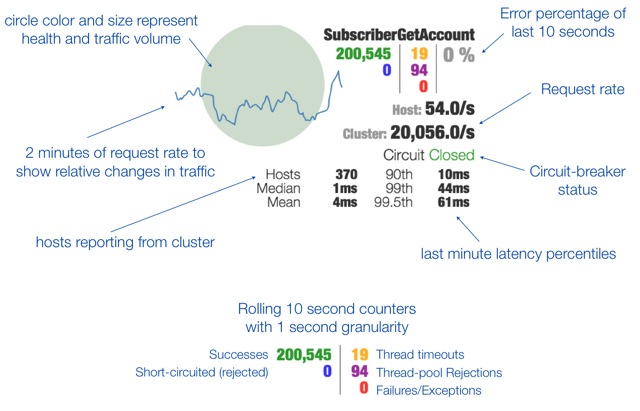
Use the Metrics Service to view HTTP metrics such as number of requests, response times, and error rates. The below image describes the information provided in the Metrics Service dashboard.
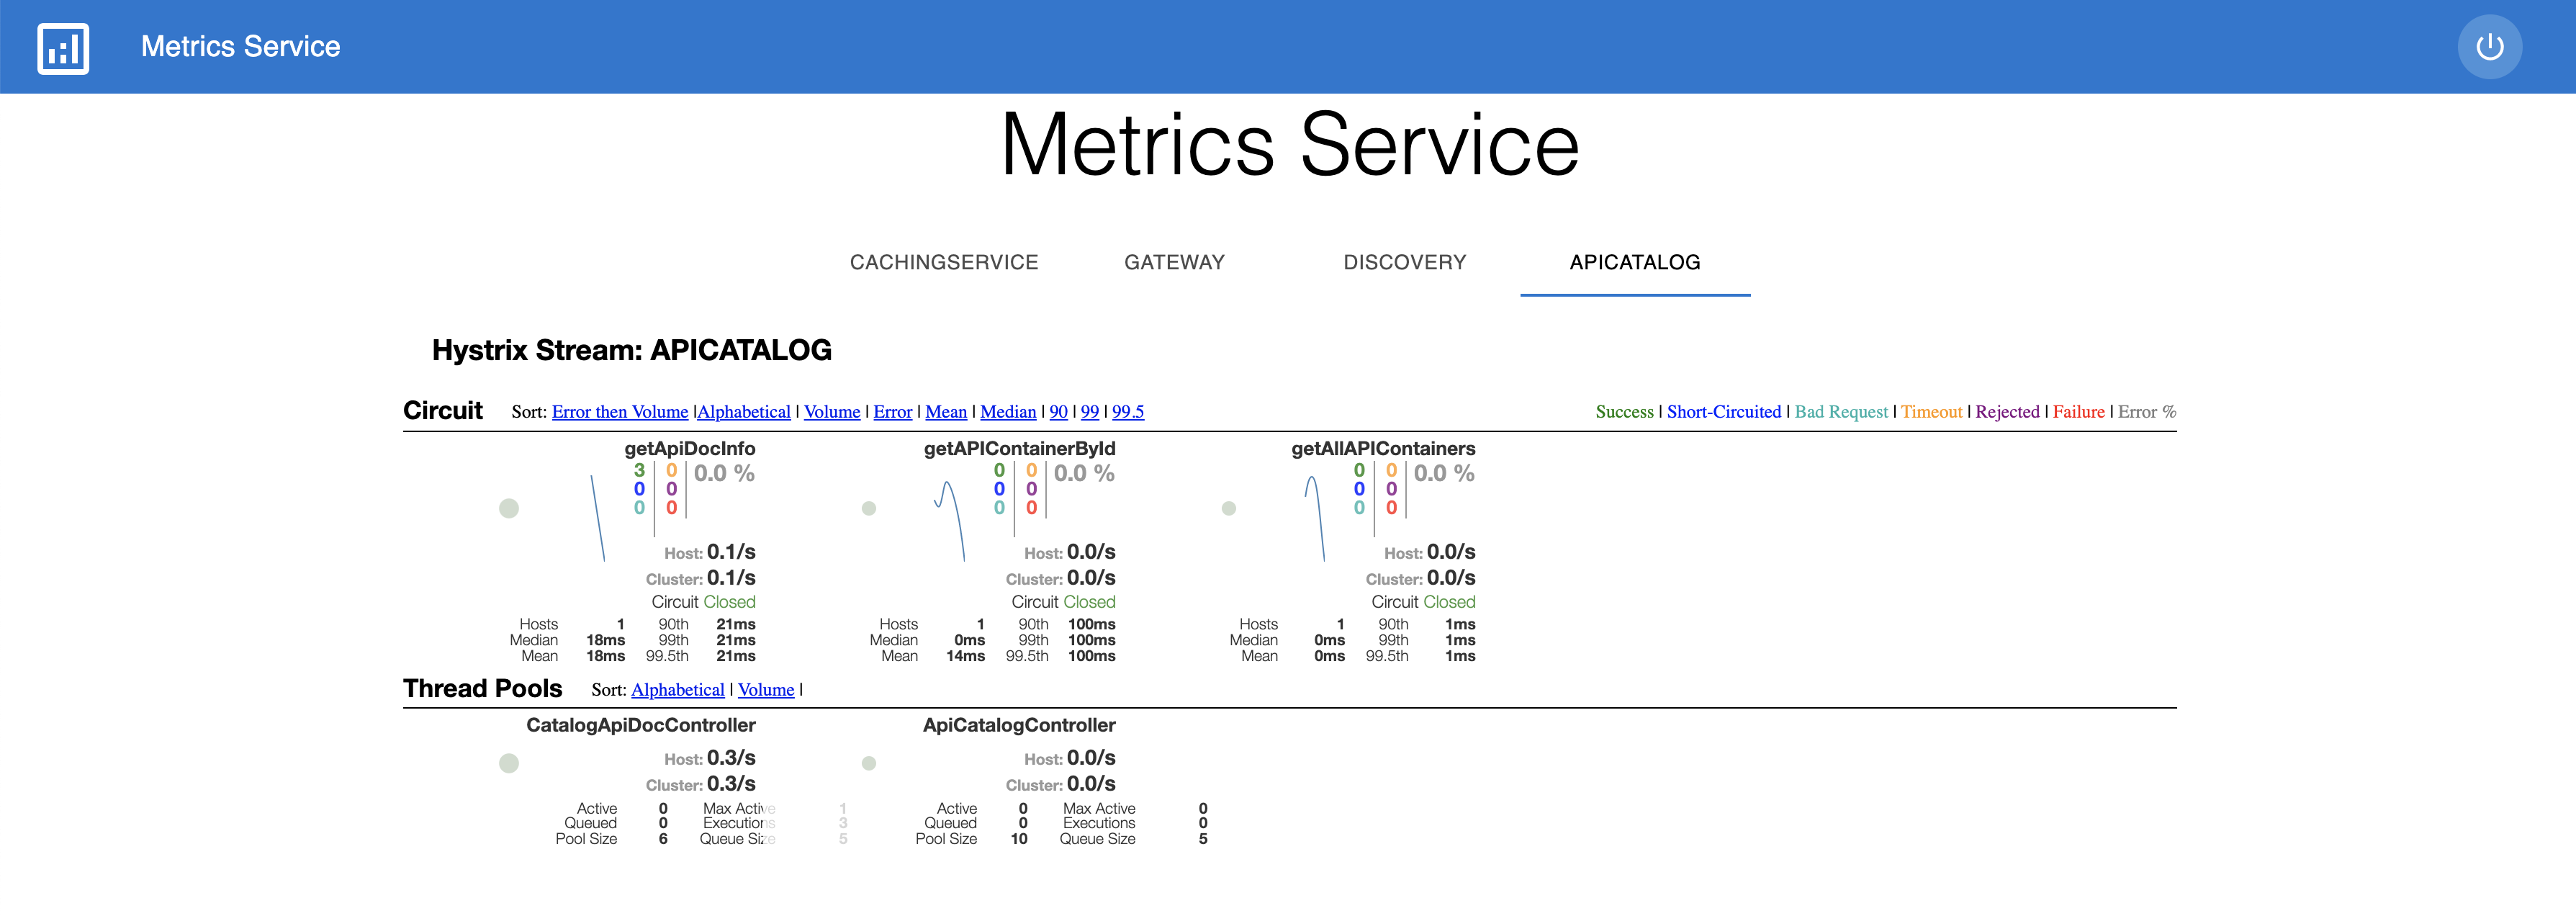
To view the HTTP metrics for a service, select the corresponding tab in the Metrics Service dashboard. Metrics are displayed for each endpoint of a service, aggregated from all service instances.
Example:
Metrics are provided on a near real-time basis, so the display shows the current activity of the selected service. At this time there is no persistence for this information.
Service instances expose their HTTP metrics at https://<service_host>:<service_port>/application/hystrix.stream using the Server-Sent-Events protocol. The Metrics Service collects these streams and aggregates them across service instances before displaying.
Note: At this time, the /application/hystrix.stream endpoint does not require authentication if APIML_METRICS_ENABLED is set to true. If APIML_METRICS_ENABLED is not set to true, the Metrics Service does not start, and /application/hystrix.stream endpoints are protected by authentication.